Pie Charts
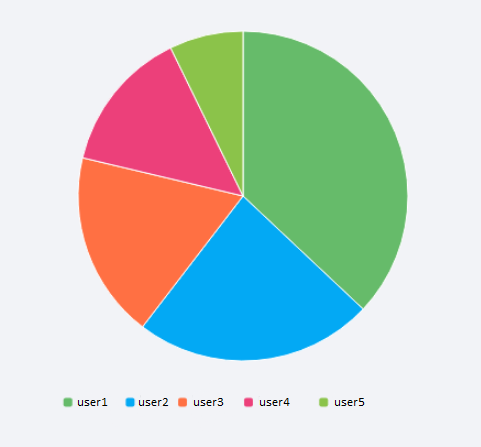
UTMStack’s visualization editor also offers the option to visualize your data in the form of a Pie chart. Pie charts are excellent for displaying the proportional breakdown of different categories within a dataset.
Chart Customization Options
You can personalize various aspects of your Pie chart to meet specific needs. The following sections explain the settings available under the Options tab when creating a Pie chart.
In the Pie options, you can find the Pie chart is a donut? option. By enabling this, your Pie chart will be transformed into a Donut chart.
Legend
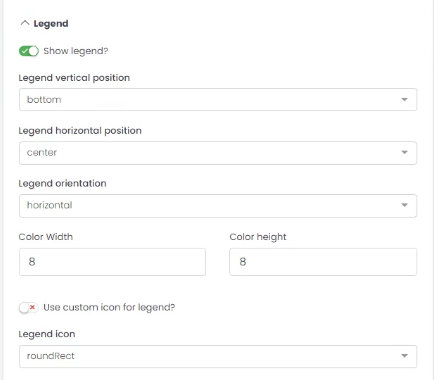
- Show Legend?: Option to display/hide the legend.
- Legend Vertical Position: Choose the vertical position of the legend (e.g., ‘bottom’).
- Legend Horizontal Position: Choose the horizontal position of the legend (e.g., ‘center’).
- Legend Orientation: Choose the orientation of the legend (e.g., ‘horizontal’).
- Color Width/Height: Adjust the size of the color boxes in the legend.
- Use Custom Icon for Legend?: Option to use a custom icon in the legend.
- Legend Icon: Choose the shape of the legend icons (e.g., ‘roundRect’).
Toolbox
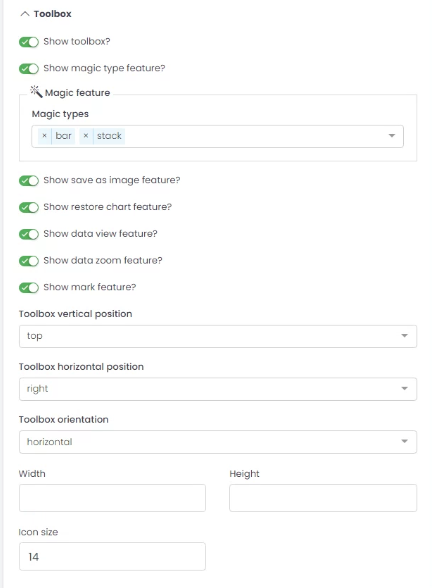
- Show Toolbox?: Option to display/hide the toolbox.
- Show Magic Type Feature?: Option to enable/disable magic type features.
- Magic Feature: Enable magic types to switch between different chart types.
- Show Save as Image Feature?: Option to enable/disable saving chart as an image.
- Show Restore Chart Feature?: Option to enable/disable the feature to restore the chart to its original state.
- Show Data View Feature?: Option to enable/disable the data view feature.
- Show Data Zoom Feature?: Option to enable/disable the data zoom feature.
- Show Mark Feature?: Option to enable/disable the mark feature.
- Toolbox Vertical Position: Choose the vertical position of the toolbox (e.g., ‘top’).
- Toolbox Horizontal Position: Choose the horizontal position of the toolbox (e.g., ‘right’).
- Toolbox Orientation: Choose the orientation of the toolbox (e.g., ‘horizontal’).
- Width/Height: Adjust the size of the toolbox.
- Icon Size: Adjust the size of the toolbox icons.
Colors
Adjust the color sequence for your chart data series.
Grid
- Top/Left/Right/Bottom: Adjust the chart margins.
DataZoom
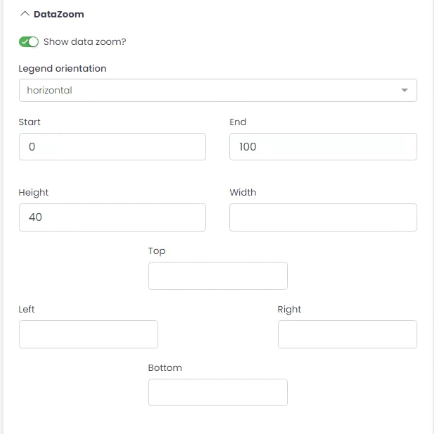
- Show Data Zoom?: Option to enable/disable the data zoom feature.
- Legend Orientation: Choose the orientation of the data zoom (e.g., ‘horizontal’).
- Start/End: Set the initial view of the data in percentage.
- Height/Width: Adjust the size of the data zoom control.
- Top/Left/Right/Bottom: Adjust the margins for the data zoom control.