Goal Chart
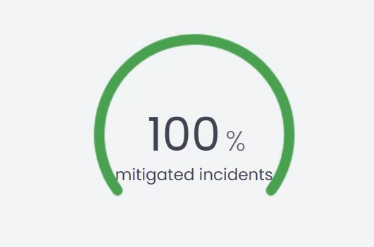
A Goal chart is a visualization tool used to represent progress towards a specific target or goal. It’s a powerful way to show progress and motivate performance. UTMStack offers a Goal chart with customizable options to suit your specific requirements.
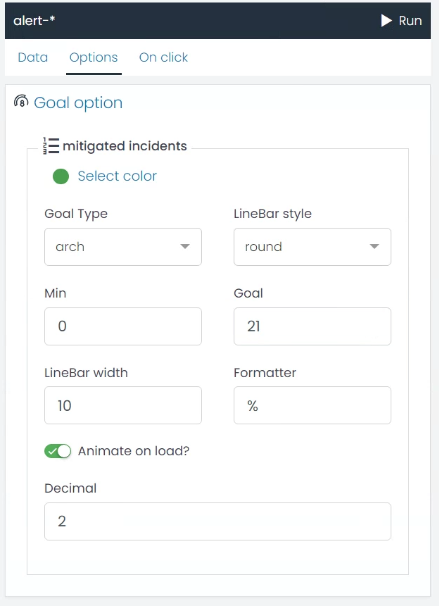
Here are the options that you can configure while creating a Goal chart:
- Color: You can select the color of the goal chart.
- Goal Type: Choose the type of Goal chart. You have the option to choose ‘semi’,’arch’ or ‘full’.
- LineBar style: Choose the style for the LineBar in the Goal chart. You can select ‘round’ or ‘butt’.
- Min: This is the starting point or minimum value of your goal.
- Goal: This is the target or the goal you aim to reach.
- LineBar width: Adjust the width of the LineBar.
- Formatter: This option allows you to choose how the value is represented. If you want the value to be represented as a percentage, you can select ‘%’.
- Animate on load?: This option allows you to decide if you want the chart to animate when it loads.
- Decimal: Adjust the number of decimal places you want to display in your Goal chart.
These options offer a high degree of flexibility and can be adjusted to create a Goal chart that aligns with your specific needs.